
Understanding Your Pace Chart and RPE
Your pace chart shows the training paces your program is built around, and RPE is how you rate the effort behind them. Together, they're how your program measures a workout from both sides.
Your pace chart
You'll find your pace chart near the top of each run workout, with all pace ranges defined for all RPE values. The pace defined is the faster bound, therefore the focus should be on running at, or slightly slower, than that pace. But remember, your primary goal for your training is to run based off of feel. The table provided below is supposed to serve as a guide, not as your running bible.
RPE: rating how a run actually felt
RPE, or Rate of Perceived Exertion, is simply how hard a run felt to you, on a scale, regardless of what your watch says about pace.
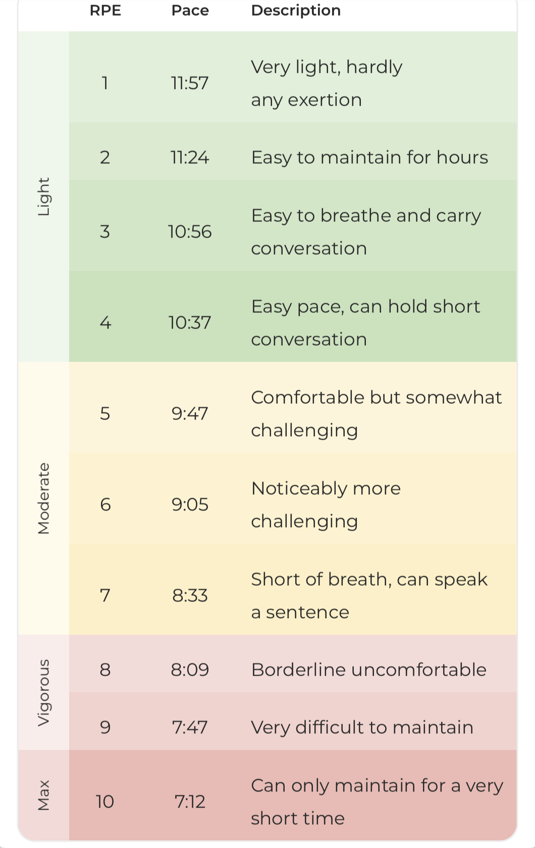
NOTE: The paces shown here are just an example; everyone's pace chart looks slightly different depending on their fitness level.
Conditions change. Heat, hills, fatigue, and stress all affect how hard a given pace feels on a given day. RPE captures that, where a fixed pace target can't. Logging RPE honestly helps RunDNA understand how your training is actually landing, not just what the numbers say it should feel like.
Together, your pace chart and your RPE tell two sides of the same story: what your program expects a workout to look like on paper, and how it felt to you when you ran it.